Debugging and observing the startup of the istio-proxy Envoy sidecar#
Learning about the initialization of the Envoy sidecar under Istio will help you understand how Envoy builds its entire event-driven and threaded interaction system. Listener socket event monitor initialization is the key point. The most direct way to get this knowledge is to debug the Envoy initialization process, so that you can directly observe the running Envoy code, rather than reading boring OOP code to guess the real behavior. However, there are a few hurdles to overcome in order to debug sidecar initialization. This article documents the process of getting through it.
This article is based on my previous article: Remote debugging an Envoy sidecar running in an Istio mesh by lldb at C++ source code level. You may need to look at the former for context to read this article more easily.
The Difficulty of initialization debugging#
Experienced programmers know that the difficulty of debugging is inversely proportional to the frequency of the target scenario to be debugged. The initialization of sidecar only happens once.
To debug istio-proxy(Envoy), you need to go through several steps:
Istio auto inject sidecar starts Envoy automatically when the container starts, it is difficult to complete the remote debug attach and breakpoint settings before initialization.
/usr/local/bin/pilot-agentis responsible for running the/usr/local/bin/envoyprocess and acts as its parent, i.e., you can’t directly control the startup of the envoy process.
I’ll explain how to avoid this.
Envoy’s startup attach method#
There are two scenarios in which the Envoy startup attach method can be used.
istio-proxy container with Istio auto inject (I didn’t use this method, see appendix section)
manually injected istio-proxy container (I use this method)
Manually injected istio-proxy container#
One way to easily and precisely attach the envoy process before envoy starts initializing is to not automatically start envoy when the container starts. to manually start pilot-agent, one way is to not auto inject sidecar, and manually inject it with istioctl:
1. Customizing the istio-proxy environment for manual pull-ups#
# fortio-server.yaml is the k8s StatefulSet/deployment where the pod is defined
$ ./istioctl kube-inject -f fortio-server.yaml > fortio-server-injected.yaml
$ vi fortio-server-injected.yaml

apiVersion: apps/v1
kind: StatefulSet
metadata:
  creationTimestamp: null
  labels:
    app: fortio-server
  name: fortio-server
spec:
  replicas: 1
  selector:
    matchLabels:
      app: fortio-server
  serviceName: fortio-server
  template:
    metadata:
      annotations:
        kubectl.kubernetes.io/default-container: main-app
        kubectl.kubernetes.io/default-logs-container: main-app
        prometheus.io/path: /stats/prometheus
        prometheus.io/port: "15020"
        prometheus.io/scrape: "true"
        sidecar.istio.io/proxyImage: 192.168.122.1:5000/proxyv2:1.17.2-debug
        sidecar.istio.io/inject: "false" # insert this line
      creationTimestamp: null
      labels:
        app: fortio-server
        app.kubernetes.io/name: fortio-server
        security.istio.io/tlsMode: istio
        service.istio.io/canonical-name: fortio-server
        service.istio.io/canonical-revision: latest
    spec:
      containers:
      - args:
        - 10d
        command:
        - /bin/sleep #do not run pilot-agent
        image: docker.io/nicolaka/netshoot:latest
        imagePullPolicy: IfNotPresent
        name: main-app
        ports:
        - containerPort: 8080
          name: http
          protocol: TCP
        resources: {}
      - args:
        - 20d
        command:
        - /usr/bin/sleep
        env:
        - name: JWT_POLICY
          value: third-party-jwt
        - name: PILOT_CERT_PROVIDER
          value: istiod
        - name: CA_ADDR
          value: istiod.istio-system.svc:15012
        - name: POD_NAME
          valueFrom:
            fieldRef:
              fieldPath: metadata.name
        - name: POD_NAMESPACE
          valueFrom:
            fieldRef:
              fieldPath: metadata.namespace
        - name: INSTANCE_IP
          valueFrom:
            fieldRef:
              fieldPath: status.podIP
        - name: SERVICE_ACCOUNT
          valueFrom:
            fieldRef:
              fieldPath: spec.serviceAccountName
        - name: HOST_IP
          valueFrom:
            fieldRef:
              fieldPath: status.hostIP
        - name: PROXY_CONFIG
          value: |
            {}
        - name: ISTIO_META_POD_PORTS
          value: |-
            [
                {"name":"http","containerPort":8080,"protocol":"TCP"}
                ,{"name":"http-m","containerPort":8070,"protocol":"TCP"}
                ,{"name":"grpc","containerPort":8079,"protocol":"TCP"}
            ]
        - name: ISTIO_META_APP_CONTAINERS
          value: main-app
        - name: ISTIO_META_CLUSTER_ID
          value: Kubernetes
        - name: ISTIO_META_NODE_NAME
          valueFrom:
            fieldRef:
              fieldPath: spec.nodeName
        - name: ISTIO_META_INTERCEPTION_MODE
          value: REDIRECT
        - name: ISTIO_META_MESH_ID
          value: cluster.local
        - name: TRUST_DOMAIN
          value: cluster.local
        image: 192.168.122.1:5000/proxyv2:1.17.2-debug
        name: istio-proxy
        ports:
        - containerPort: 15090
          name: http-envoy-prom
          protocol: TCP
        - containerPort: 2159
          name: http-m
          protocol: TCP
        resources:
          requests:
            cpu: 100m
            memory: 128Mi
        securityContext:
          allowPrivilegeEscalation: true
          capabilities:
            add:
            - ALL
          privileged: true
          readOnlyRootFilesystem: false
          runAsGroup: 1337
          runAsNonRoot: true
          runAsUser: 1337
        volumeMounts:
        - mountPath: /var/run/secrets/workload-spiffe-uds
          name: workload-socket
        - mountPath: /var/run/secrets/credential-uds
          name: credential-socket
        - mountPath: /var/run/secrets/workload-spiffe-credentials
          name: workload-certs
        - mountPath: /var/run/secrets/istio
          name: istiod-ca-cert
        - mountPath: /var/lib/istio/data
          name: istio-data
        - mountPath: /etc/istio/proxy
          name: istio-envoy
        - mountPath: /var/run/secrets/tokens
          name: istio-token
        - mountPath: /etc/istio/pod
          name: istio-podinfo
      restartPolicy: Always
      volumes:
      - name: workload-socket
      - name: credential-socket
      - name: workload-certs
      - emptyDir:
          medium: Memory
        name: istio-envoy
      - emptyDir: {}
        name: istio-data
      - downwardAPI:
          items:
          - fieldRef:
              fieldPath: metadata.labels
            path: labels
          - fieldRef:
              fieldPath: metadata.annotations
            path: annotations
        name: istio-podinfo
      - name: istio-token
        projected:
          sources:
          - serviceAccountToken:
              audience: istio-ca
              expirationSeconds: 43200
              path: istio-token
      - configMap:
          name: istio-ca-root-cert
        name: istiod-ca-cert
  updateStrategy: {}
status:
  availableReplicas: 0
  replicas: 0
$ kubectl apply -f fortio-server-injected.yaml
To avoid unexpected exits of kubectl exec starting processes in containers, and to allow multiple accesses to the same shell instance, I use tmux:
kubectl exec -it fortio-server-0 -c istio-proxy -- bash
sudo apt install -y tmux
I only want one app(uid=1000) user’s outbound traffic to go through the envoy, and no other outbound traffic to go through the envoy:
kubectl exec -it fortio-server-0 -c main-app -- bash

adduser -u 1000 app
kubectl exec -it fortio-server-0 -c istio-proxy -- bash
tmux # start tmux server

sudo iptables-restore <<"EOF"
*nat
:PREROUTING ACCEPT [8947:536820]
:INPUT ACCEPT [8947:536820]
:OUTPUT ACCEPT [713:63023]
:POSTROUTING ACCEPT [713:63023]
:ISTIO_INBOUND - [0:0]
:ISTIO_IN_REDIRECT - [0:0]
:ISTIO_OUTPUT - [0:0]
:ISTIO_REDIRECT - [0:0]
-A PREROUTING -p tcp -j ISTIO_INBOUND
-A OUTPUT -p tcp -j ISTIO_OUTPUT
-A ISTIO_INBOUND -p tcp -m tcp --dport 15008 -j RETURN
-A ISTIO_INBOUND -p tcp -m tcp --dport 15090 -j RETURN
-A ISTIO_INBOUND -p tcp -m tcp --dport 15021 -j RETURN
-A ISTIO_INBOUND -p tcp -m tcp --dport 15020 -j RETURN
# do not redirect remote lldb inbound
-A ISTIO_INBOUND -p tcp -m tcp --dport 2159 -j RETURN
-A ISTIO_INBOUND -p tcp -j ISTIO_IN_REDIRECT
-A ISTIO_IN_REDIRECT -p tcp -j REDIRECT --to-ports 15006
-A ISTIO_OUTPUT -s 127.0.0.6/32 -o lo -j RETURN
-A ISTIO_OUTPUT ! -d 127.0.0.1/32 -o lo -m owner --uid-owner 1337 -j ISTIO_IN_REDIRECT
-A ISTIO_OUTPUT -o lo -m owner ! --uid-owner 1337 -j RETURN
-A ISTIO_OUTPUT -m owner --uid-owner 1337 -j RETURN
# only redirct app user outbound
-A ISTIO_OUTPUT -m owner ! --uid-owner 1000 -j RETURN
-A ISTIO_OUTPUT ! -d 127.0.0.1/32 -o lo -m owner --gid-owner 1337 -j ISTIO_IN_REDIRECT
-A ISTIO_OUTPUT -o lo -m owner ! --gid-owner 1337 -j RETURN
# only redirct app user outbound
-A ISTIO_OUTPUT -m owner ! --gid-owner 1000 -j RETURN
-A ISTIO_OUTPUT -m owner --gid-owner 1337 -j RETURN
-A ISTIO_OUTPUT -d 127.0.0.1/32 -j RETURN
-A ISTIO_OUTPUT -j ISTIO_REDIRECT
-A ISTIO_REDIRECT -p tcp -j REDIRECT --to-ports 15001
COMMIT
EOF
2. Start remote debug server and vscode debug session#
Start the remote debug server on the worker node where istio-proxy is running.
ssh labile@192.168.122.55 # ssh to the worker node where istio-proxy is running.

# Get the PID of a process in the istio-proxy container
export POD="fortio-server-0"
ENVOY_PIDS=$(pgrep sleep) # There is a process called /usr/bin/sleep in the container.
while IFS= read -r ENVOY_PID; do
    HN=$(sudo nsenter -u -t $ENVOY_PID hostname)
    if [[ "$HN" = "$POD" ]]; then # space between = is important
        sudo nsenter -u -t $ENVOY_PID hostname
        export POD_PID=$ENVOY_PID
    sudo nsenter -u -t $ENVOY_PID
done <<< "$ENVOY_PIDS"
echo $POD_PID
export PID=$POD_PID

# Start the remote debug server
sudo nsenter -t $PID -u -p -m bash -c 'lldb-server platform --server --listen *:2159' # Note the absence of -n.
``.


> Why not use kubectl port forward?
>
> I tried:
>
> ```bash
> kubectl port-forward --address 0.0.0.0 pods/fortio-server-0 2159:2159
> ```
>
> Possibly due to heavy debug traffic, the forward is very unstable.


In the `.vscode/launch.json` file of `lldb-vscode-server`, add a debug configuration:

```json
{
    "version": "0.2.0",
    "configurations": [
		{
            "name": "AttachLLDBWaitRemote",
            "type": "lldb",
            "request": "attach",
            "program": "/usr/local/bin/envoy",
            // "stopOnEntry": true,
            "waitFor": true,
            "sourceMap": {
                "/proc/self/cwd": "/work/bazel-work",
                "/home/.cache/bazel/_bazel_root/1e0bb3bee2d09d2e4ad3523530d3b40c/sandbox/linux-sandbox/263/execroot/io_istio_proxy": "/work/bazel-work"
            },
            "initCommands": [
                // "log enable lldb commands",
                "platform select remote-linux", // Execute `platform list` for a list of available remote platform plugins.
                "platform connect connect://192.168.122.55:2159",
            ],
        }
Then start AttachLLDBWaitRemote in vscode. This establishes a connection to lldb-server and analyzes /usr/local/bin/envoy. Since this is a 1GB ELF, this step took over a minute on my machine with 100% CPU and 16GB RSS memory. When it’s done, you can see that istio-proxy has a 100% CPU lldb-server process, which is actually "waitFor": true commanding lldb-server to keep scanning the process list.
2.1 Setting breakpoints#
You can set breakpoints at your point of interest, I am:
envoy/source/exe/main.cc ie: Envoy::MainCommon::main(...)
3. Start pilot-agent and envoy#
kubectl exec -it fortio-server-0 -c istio-proxy -- bash

tmux a # start tmux server before any new connection

/usr/local/bin/pilot-agent proxy sidecar --domain ${POD_NAMESPACE}.svc.cluster.local --proxyLogLevel=warning --proxyComponentLogLevel=misc:error --log_output_level=default:info --concurrency 2


2023-06-05T08:04:25.267206Z     info    Effective config: binaryPath: /usr/local/bin/envoy
concurrency: 2
configPath: ./etc/istio/proxy
controlPlaneAuthPolicy: MUTUAL_TLS
discoveryAddress: istiod.istio-system.svc:15012
drainDuration: 45s
proxyAdminPort: 15000
serviceCluster: istio-proxy
statNameLength: 189
statusPort: 15020
terminationDrainDuration: 5s
tracing:
  zipkin:
    address: zipkin.istio-system:9411
...
2023-06-05T08:04:25.754381Z     info    Starting proxy agent
2023-06-05T08:04:25.755875Z     info    starting
2023-06-05T08:04:25.758098Z     info    Envoy command: [-c etc/istio/proxy/envoy-rev.json --drain-time-s 45 --drain-strategy immediate --local-address-ip-version v4 --file-flush-interval-msec 1000 --disable-hot-restart --allow-unknown-static-fields --log-format %Y-%m-%dT%T.%fZ       %l      envoy %n %g:%#  %v      thread=%t -l warning --component-log-level misc:error --concurrency 2]
4. 开始 debug#
At this point, lldb-server scans for envoy process starts, attaches and hangs the envoy process, and then notifies vscode. vscode sets a breakpoint and continues the envoy run, then the process runs to the breakpoint, and vscode feeds back to the GUI.
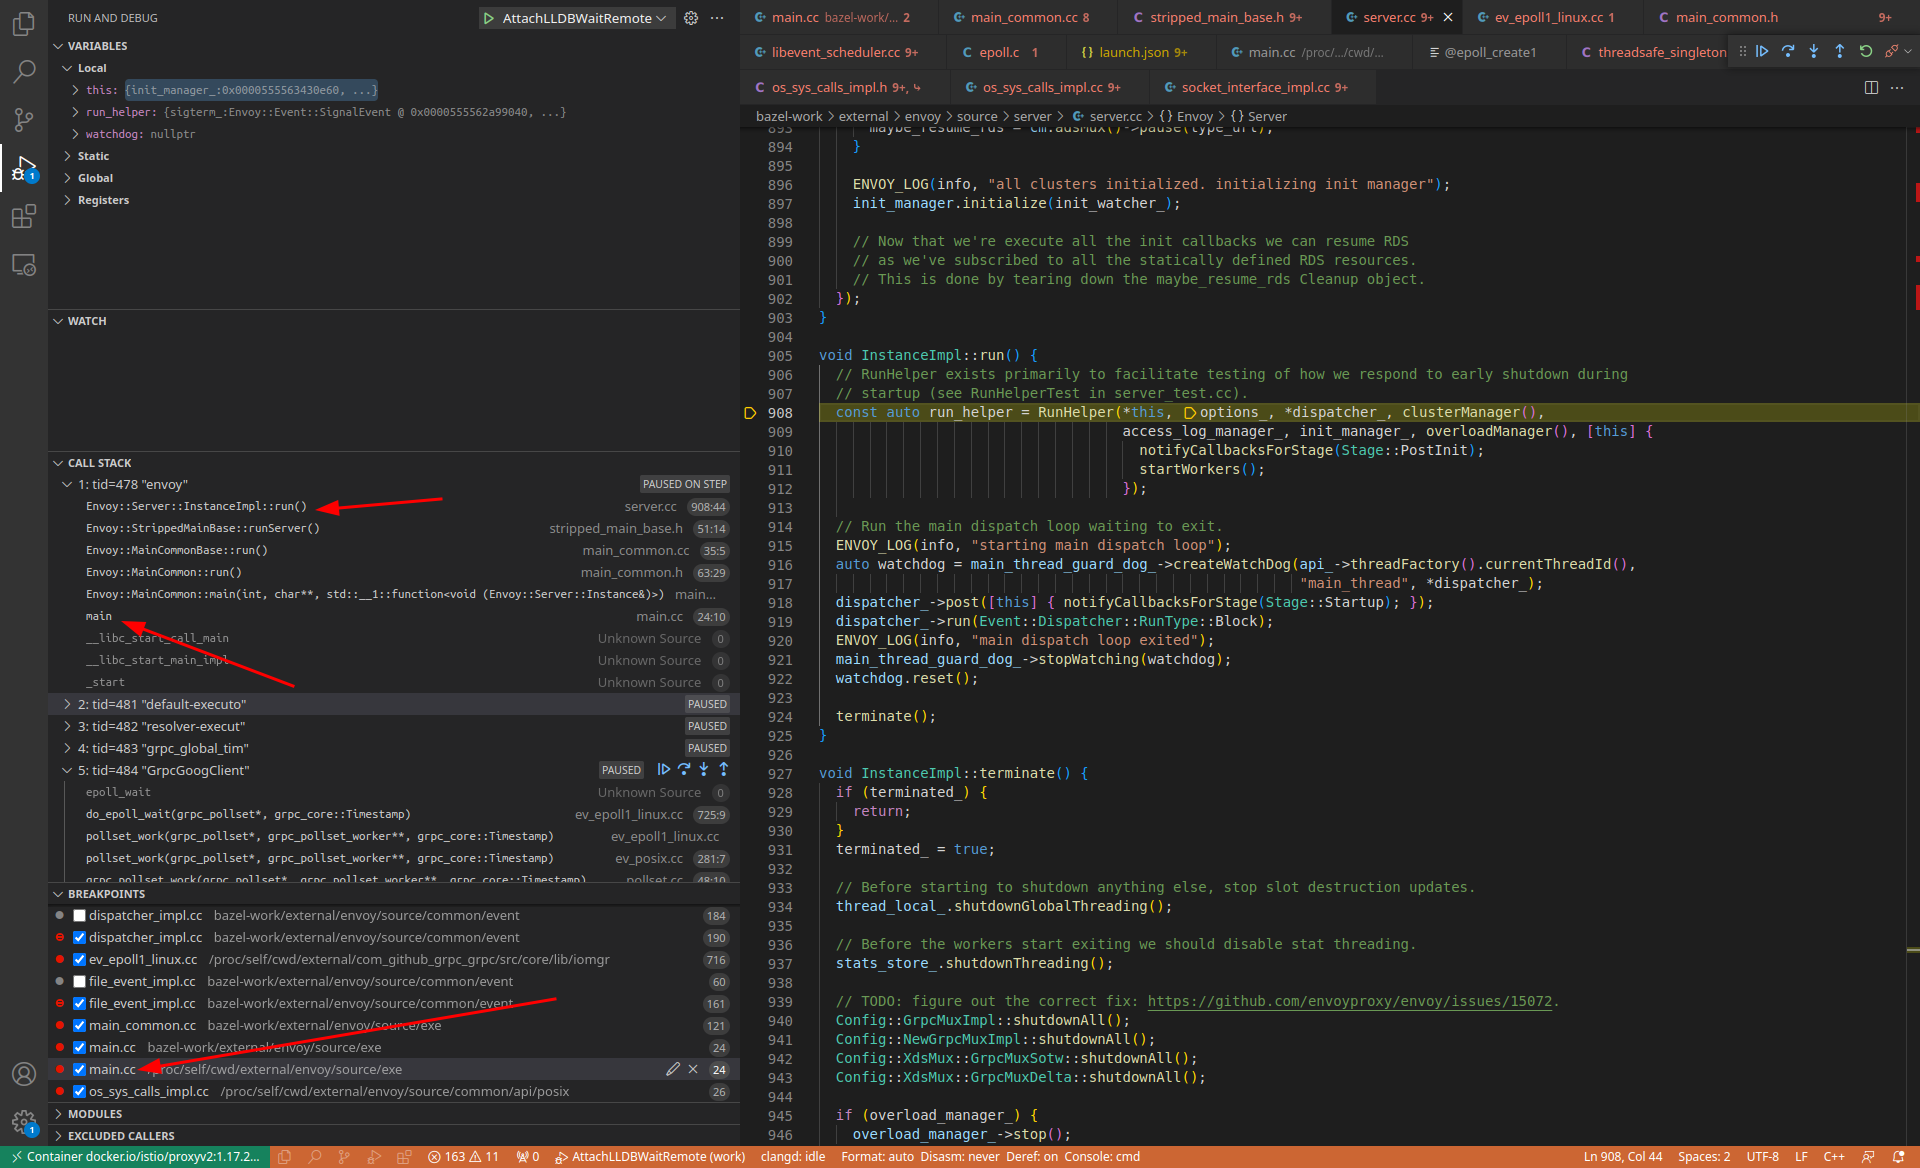
Common breakpoints#
Here are some of the breakpoints I commonly use:
# Envoy directly invoked system call
breakpoint set --func-regex .*OsSysCallsImpl.*

# libevent 的 syscall
breakpoint set --shlib libc.so.6 --func-regex 'epoll_create.*|epoll_wait|epoll_ctl'

breakpoint set --shlib libc.so.6 --basename 'epoll_create'
breakpoint set --shlib libc.so.6 --basename 'epoll_create1'
breakpoint set --shlib libc.so.6 --basename 'epoll_wait'
breakpoint set --shlib libc.so.6 --basename 'epoll_ctl'
Appendices - some memos to myself#
Istio auto inject for sidecar container (I did not use this method)#
Anyone who has done k8s Ops knows that a problem that is encountered from time to time, but lacks a non-invasive way to locate it, is that containers start up with errors. It’s hard to find a way to pause the startup process with an error, leaving plenty of time for a human to get into the environment and do troubleshooting, and debuggers like gdb/lldb have this innate “magic” of making arbitrary processes hang.
For the Istio auto inject sidecar container, it is very difficult to attach to a freshly started envoy process before the envoy is initialized. There are a couple of theoretically possible ways to do this (note: I have not tested this):
Debugger wait process on worker node
debugger follow process fork
debugger wrapper script
Here is a brief explanation of the theory.
Debugger wait process on worker node#
在 worker node 上,让 gdb/lldb 不断扫描进程列表,发现 envoy 立即 attach
For gdb, online there’s a script.
/bin/sh /bin/sh
# The following script requires that there is no envoy process running on the worker node before it starts
progstr=envoy
progpid = `pgrep -o $progstr`
while [ "$progpid" = "" ]; do
  progpid=`pgrep -o $progstr`
continue -p
gdb -ex continue -p $progpid
For lldb, the subject of this article, there are built-in methods:
(lldb) process attach --name /usr/local/bin/envoy --waitfor
The downside of this method is that debugger(gdb/lldb) and debuggee(envoy) are running in different pid namespace and mount namespace, which can cause a lot of strange problems with debugger, so it is not recommended.
Debugger follow process fork#
We know:
The
envoyprocess is started by the container’s pid 1 process, in this casepilot-agent.The
pilot-agentprocess is started by the short-livedruncprocess.The
runcprocess is started by the/usr/local/bin/containerd-shim-runc-v2process.containerd-shim-runc-v2started by/usr/local/bin/containerd.
Reference: https://iximiuz.com/en/posts/implementing-container-runtime-shim/
Just use debugger to trace containerd, follow process fork step by step to exec /usr/local/bin/envoy.
For gdb you can use
(gdb) set follow-fork-mode child
See also:
[https://visualgdb.com/gdbreference/commands/set_follow-fork-mode](https://visualgdb.com/gdbreference/commands/set_follow-fork- mode)
Works for lldb:
(lldb) settings set target.process.follow-fork-mode child
Debugger wrapper script#
There is no way to directly modify pilot-agent to inject the debugger, but you can replace /usr/local/bin/envoy with a wrapper script and start the debugger from that wrapper script , and let the debugger start the real envoy. ELF.
This can be done by modifying the istio-proxy docker image:
As:
``bash mv /usr/local/bin/envoy /usr/local/bin/real_envoy_elf vi /usr/local/bin/envoy … chmod +x /usr/local/bin/envoy
``/usr/local/bin/envoy` Write this:

```bash
/usr/local/bin/envoy` Write this: ``bash /bin/bash

# This is a gdb wrapper script.
# Get the arguments passed to the script.
args=$@
# Start gdb.
gdb -ex=run --args /usr/local/bin/real_envoy_elf $args
Traffic debug#
Initiate some outbound traffic through envoy:
kubectl exec -it fortio-server-0 -c main-app -- bash

su app
curl -v www.baidu.com
lldb common command list#
lldb
(lldb) process attach --name pilot-agent --waitfor
(lldb) platform process attach --name envoy --waitfor